
Step-By-Step NOAA Weather Map
Join me as I build a custom interactive weather map

Hello Readers!
Thank you for joining Globechalk Geographics, LLC with this kickoff of the Globechalk Design Board (GDB) substack. The GDB is a place where you can find tutorials for GIS design and spatial data programming, as well as the camaraderie and community of your fellow cartographers and geospatial enthusiasts.
With this kickoff, we’ll make an interactive map loading data from the NOAA National Weather Service API. I’m very interested in weather station data specifically, and not very enthused by the clunkiness of the map design on the NWS website.
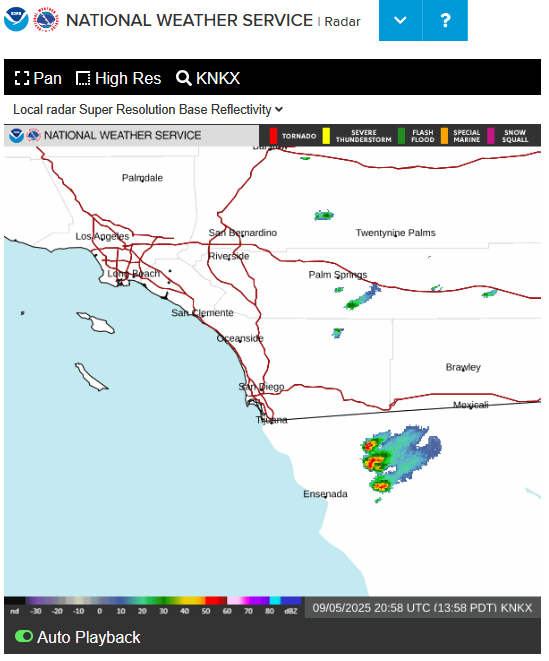
While I find the temperature data on NWS to be more accurate than those from other services, I want to see all weather station data on the map, and I want a sleek, quick-loading modern experience. I believe we can achieve that using a different mapping platform and the NWS API.
The duration of this tutorial is for now unknown. This particular type of mapping app is not one I’ve made before, but one I’ve been interested in doing for a while. That means you’ll be learning along with me. Isn’t this a common theme for GIS professionals? You sign on for a project you know how to approach 75% of, but there’s that little extra stretch that requires your learning and ingenuity. Maybe you also think the on-the-spot problem-solving is the best part!
Here’s what you can count on from this series:
Together we’ll make an interactive Leaflet JS map, load weather station data from the NWS API, and symbolize it to look modern.
What you’ll need:
Visual Studio Code and very basic experience in HTML and JavaScript.
Here’s to our first design board experience!